
Home as a Foundation for Life: A Maslow-Inspired Buying Guide
Align your home-buying decisions with life's fulfillment using Maslow's hierarchy of needs as a roadmap. Evaluate homes based on what truly matters.

Align your home-buying decisions with life's fulfillment using Maslow's hierarchy of needs as a roadmap. Evaluate homes based on what truly matters.

Introduction: More Than Just Another Scoring System On the surface, our risk assessment model might appear to be just another property analysis tool with fancy metrics and colorful gauges. In an industry where every real estate platform claims to have some "proprietary algorithm," skepticism is warranted. But peeling

An LLM's Attempt to Reverse Engineer the Sacred in Code
Risk Model v1
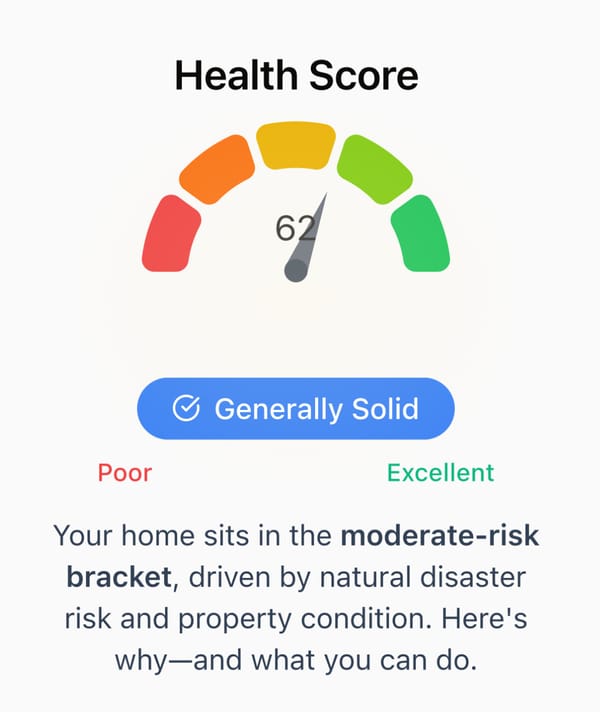
TL;DR Your Property Health Score is a single 0–100 number that aggregates eight key factors—from Property Condition to Natural Disaster Risk—into a clear snapshot of potential strengths and vulnerabilities. Below, you’ll learn: 1. What the score represents 2. How we calculate it 3. What each

Data-Driven Due Diligence
Quick Facts • In 2024, 35% of U.S. homebuyers underestimated non-mortgage living costs. • Areas with “low property taxes” often offset that with higher transportation or food costs. • The average buyer spends $12,000/year on location-driven living expenses beyond housing. Want to see the data on your own address? Run

Data-Driven Due Diligence
Quick Facts • The average U.S. single-family home is now 41 years old—the oldest in history. • Replacing aging HVAC, roofs, and plumbing systems typically costs $22k–$65k per home. • 67% of homes built before 1980 lack modern insulation or duct sealing, adding 10%–30% to energy bills annually. Want

Climate Hazards
TL;DR • 44 % of U.S. homes sit in terrain that the USGS flags as potentially landslide-prone. (Landslide Danger Looms For 44% Of U.S. Homes - Yahoo Finance) • Annual economic losses exceed $1 billion, with some estimates topping $2 billion when indirect costs are counted. (Economic Losses and Fatalities

Air Quality
TL;DR • 2023 delivered 66% more smoke-borne PM to the average American than any year since 2006. (Wildfire Smoke: Nationwide Health Risk - Climate Central) • Indoor particulate levels across the U.S. and Canada rose 17 % year-over-year—even in homes 100 mi from a fire line. (The Air Report: Indoor

Climate Hazards
Snapshot • 40 % of all NFIP flood-damage claims come from outside the high-risk (A / V) zones—mostly from the so-called “low-risk” X-zones. (Are You in a Flood Zone? What FEMA's 2024 Flood Map Mean for You) • NFIP’s average paid claim topped $66,000 between 2016-2022; the median homeowner

TL;DR • 2.6 million U.S. homes now sit in moderate-to-very-high wildfire-risk zones, with a $1.3 trillion reconstruction price tag. (CoreLogic 2024 Wildfire Risk Report Finds More Than 2.6 Million ...) • Even outside the flames, indoor PM₂.₅ spikes during smoke events can exceed EPA safe levels by 5–

Data-Driven Due Diligence
Quick Stats • Up to 45 % of major U.S. remodels never pull the required permits (NAHB survey). • Mortgage underwriters flag unpermitted square-footage as a “collateral defect,” stalling—or canceling—funding in 24 % of disputed appraisals (Fannie Mae QC data). • Average cost to retro-permit a non-conforming addition: $8,500 – $27,000