How To Read Your Property Health Score: What It Means. Why It Matters. How To Use It.

TL;DR
Your Property Health Score is a single 0–100 number that aggregates eight key factors—from Property Condition to Natural Disaster Risk—into a clear snapshot of potential strengths and vulnerabilities. Below, you’ll learn:
- What the score represents
- How we calculate it
- What each factor measures
- How to interpret your specific score
- The role of “flags” pointing out discrete risks
- Next steps for smarter home-buying decisions
1. What Is the Property Health Score?
- Range: 0–100 (higher = better)
- Benchmark: ~50 is average for U.S. homes
- Purpose: Quickly surface overall property health, combining data you can’t see on a listing: permit history, environmental indices, tax currency, and more.
2. How We Calculate Your Score
We run your property through eight independent calculators, each producing a 0–100 factor score. Those factor scores are:
- Weighted by importance
- Adjusted for data confidence
- Boosted or penalized if critical risks are detected
- Combined into one overall Health Score (with critical risks given extra weight)
Factor Weights
| Health Factor | Weight |
|---|---|
| Property Condition | 25 % |
| Property Age & Renovation | 11 % |
| Assessment Recency | 14 % |
| Cost of Living | 11 % |
| Transportation Noise | 8 % |
| Air Quality | 7 % |
| Natural Disaster Risk | 8 % |
| Crime Risk | 16 %¹ |
¹ The Crime Risk factor’s weight reflects both personal-crime (70 %) and property-crime (30 %) components.
3. What Each Factor Measures
Property Condition (25 %)
Assessor-recorded condition + quality ratings, supplemented by inferred signals (age, permits) to gauge overall upkeep.
Property Age & Renovation (11 %)
Year built, effective year built, renovation dates, and permit evidence blend into an “effective age” score.
Assessment Recency (14 %)
How current your last tax assessment is (0–8+ years), with a modest bonus/penalty if the last three valuations trend up or down.
Cost of Living (11%)
Neighborhood cost indices (housing, food, utilities, etc.) adjusted by local vs. national median income.
Transportation Noise (8%)
Road, rail, aviation, and emergency-vehicle noise levels converted to decibels, proximity-adjusted, then logarithmically combined.
Air Quality (7%)
Multiple pollutant indices (PM, ozone, NO₂, CO, lead, general air pollution) weighted by health severity, using the worst-case plus weighted-average approach.
Natural Disaster Risk (8%)
Flood-zone status (including elevation & LOMA records), plus ATTOM indices for earthquake, hurricane, tornado, and wildfire (via wind index). Uses a “worst-risk” logic so a single severe hazard isn’t averaged away.
Crime Risk (16%)
Separately scores violent crimes (murder, rape, robbery, assault) vs. property crimes (burglary, theft, larceny) with heavier emphasis on personal-safety concerns.
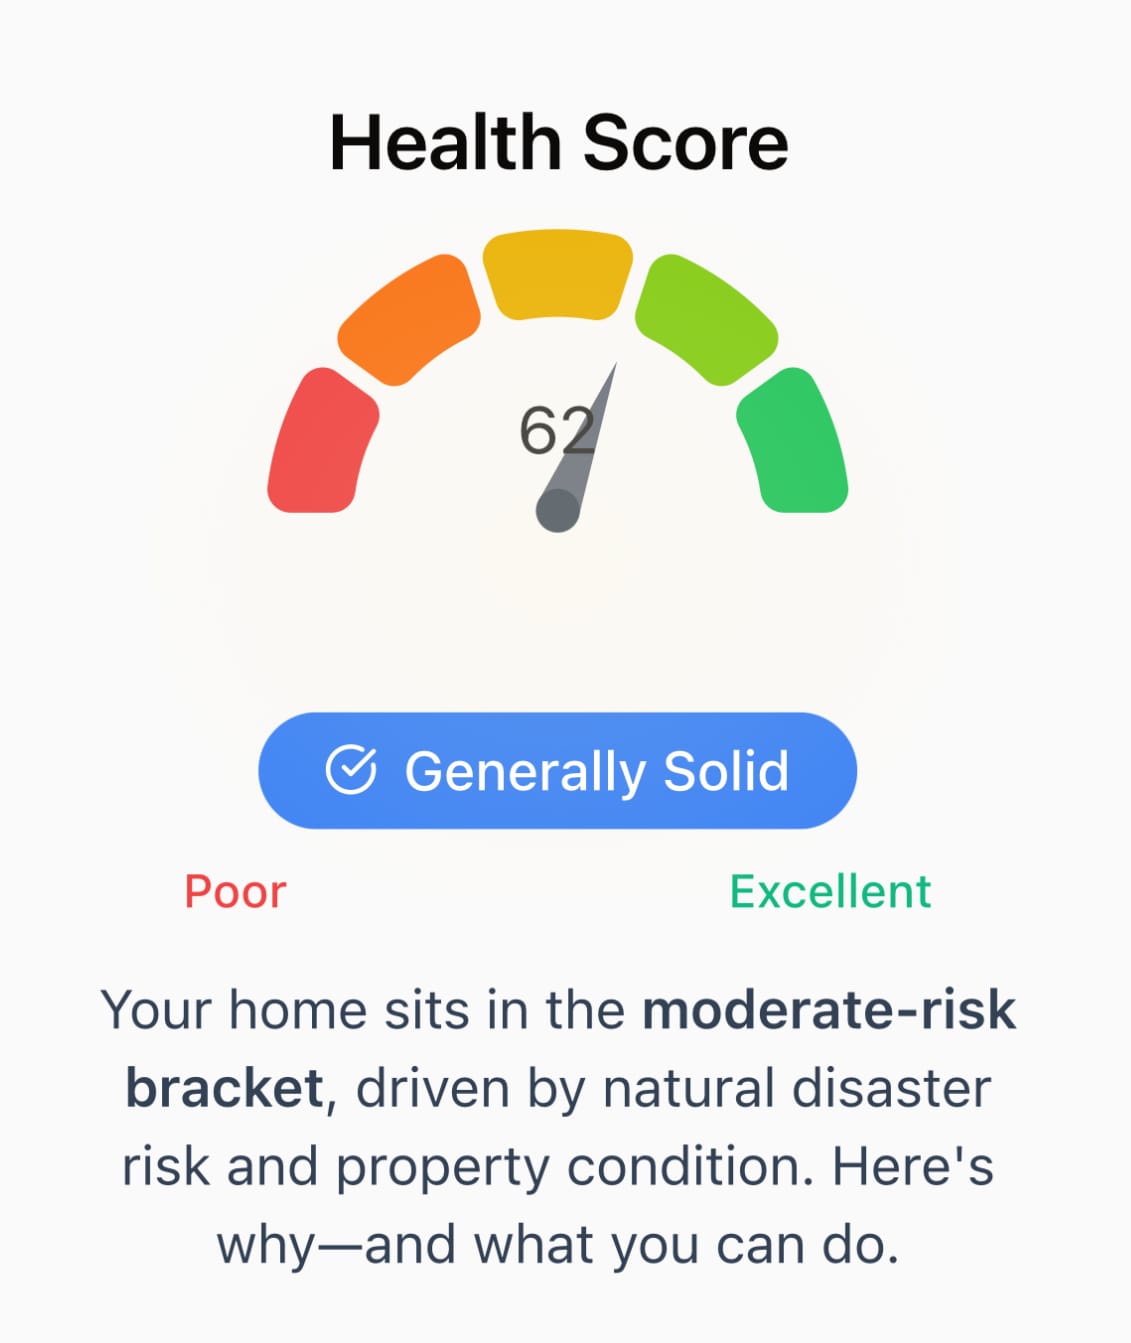
4. Interpreting Your Score
| Score | Meaning |
|---|---|
| 85–100 | Excellent – Few detectable risks; strong long-term outlook. |
| 70–84 | Good – Minor factors to review but overall solid. |
| 55–69 | Average – Typical U.S. home; check individual factors. |
| 40–54 | Below Average – Multiple moderate-severity factors; proceed with caution. |
| 0–39 | Concerning – One or more high-severity risks; further investigation recommended. |
Pro Tip: Always dive into the factor breakdown below the score to see which specific domains are pulling your score down.
5. Understanding Report “Flags”
Beyond numeric factors, we generate flags for discrete, event-based concerns:
- Recent Property Flip – Multiple sales in a short period.
- Unpermitted Renovations – Permit vs. assessor data mismatches.
- Aging Assessment – Tax assessment older than 5 years.
- Septic System – Areas without municipal sewer.
- (Additional flags based on building permits, assessor events, etc.)
Flags carry severity levels (low/medium/high) and remediation advice—so you know not just what was found, but what to do next.
6. Next Steps
- Review Your Factor Breakdown: Click into any low-scoring factor for detailed narratives and confidence scores.
- Investigate High-Severity Flags: Share your report with inspectors or lenders to address critical issues early.
- Compare Properties: Run multiple reports to see which homes have stronger health profiles.
- Negotiate from Strength: Use data-backed insights to request repairs, price adjustments, or insurance credits.
Ready to see your score?
Run a FREE sample report in 30 seconds


